As I was working on a client project, I needed to do some more in depth debugging in a PHP application. Laravel has a couple of great utilities like dd() and dump() that make the output of something like var_dump() much more readable and actionable, but sometimes it's not enough. There's another tool that came from the Laravel ecosystem called Ray that's also worth checking out. It's kinda like dump() on steroids and well worth the money in my opinion. However, the king of all debugging tools for PHP is still hands down Xdebug.
#Getting Started
Before diving in, it's important that we're all starting from the same place in regards to tools.
- You've installed and configured Laravel Valet and it is serving sites from somewhere on your local machine.
- You're using Homebrew in conjunction w/ Valet to manage PHP versions (default for Valet)
- You have installed the excellent PHP Monitor utility application.
- You have installed the Xdebug Helper Chrome Extension
- You have installed VS Code
- You have installed the PHP Debug extension for VS Code
#Installing Xdebug
Xdebug version 3 was released in late 2020 and configuring it has become much simpler assuming you are using the defaults. The documentation on the Xdebug website will work for a lot of folks, but if you use multiple PHP versions via Homebrew, sometimes the tools can get confused when installing.
First, we need to find the real path of your PHP installation. On the command line run this command:
brew info php # default php version, 8.0 at the time of writing
# or
brew info [email protected] # or [email protected] etc
This will spit out a bunch of stuff you can ignore for the most part, but we want this line:
/usr/local/Cellar/php/8.0.3
Your installation path might look different depending on your PHP version or Homebrew configuration. The important thing is that we want to go into this folder and utilize the utilities within it to install extensions using the pecl utility. By using this path, when we run pecl, it will know the correct location to find and modify configuration files.
Next, we'll install Xdebug via PECL
$ /usr/local/Cellar/php/8.0.3/bin/pecl install xdebug
This will take a minute or two depending on your machine and internet connection. When it's finished you should see this output somewhere near the bottom of your terminal.
install ok: channel://pecl.php.net/xdebug-3.0.4
Extension xdebug enabled in php.ini
If you see these lines, congratulations, you've successfully installed Xdebug!
Now, we need to configure one more thing. By default, Xdebug starts in develop mode which isn't super useful. It enhances the default error screens and var_dump() output with better formatting and stacktraces, but doesn't enable us to do step-through debugging.
Run the below command to find your php.ini location.
$ php --ini
This will show you all of the configuration files currently being used by PHP. By default, the Xdebug configuration is added to php.ini. Open that file in your favorite text editor. Mine was located at /usr/local/etc/php/7.4/php.ini
At the top of that file, just below the zend_extension="xdebug.so" line, add xdebug.mode="debug"
This tells Xdebug to start in debug mode, for, well, debugging!
While you're on the command line, go ahead and run
pecl install redisif you work on projects that utilize Redis. The PHP extension is much faster than thepredis/predisComposer package.
You can restart Valet with the following command and then use PHP Monitor to confirm Xdebug is installed. You must restart PHP for new extensions to be enabled.
$ valet restart
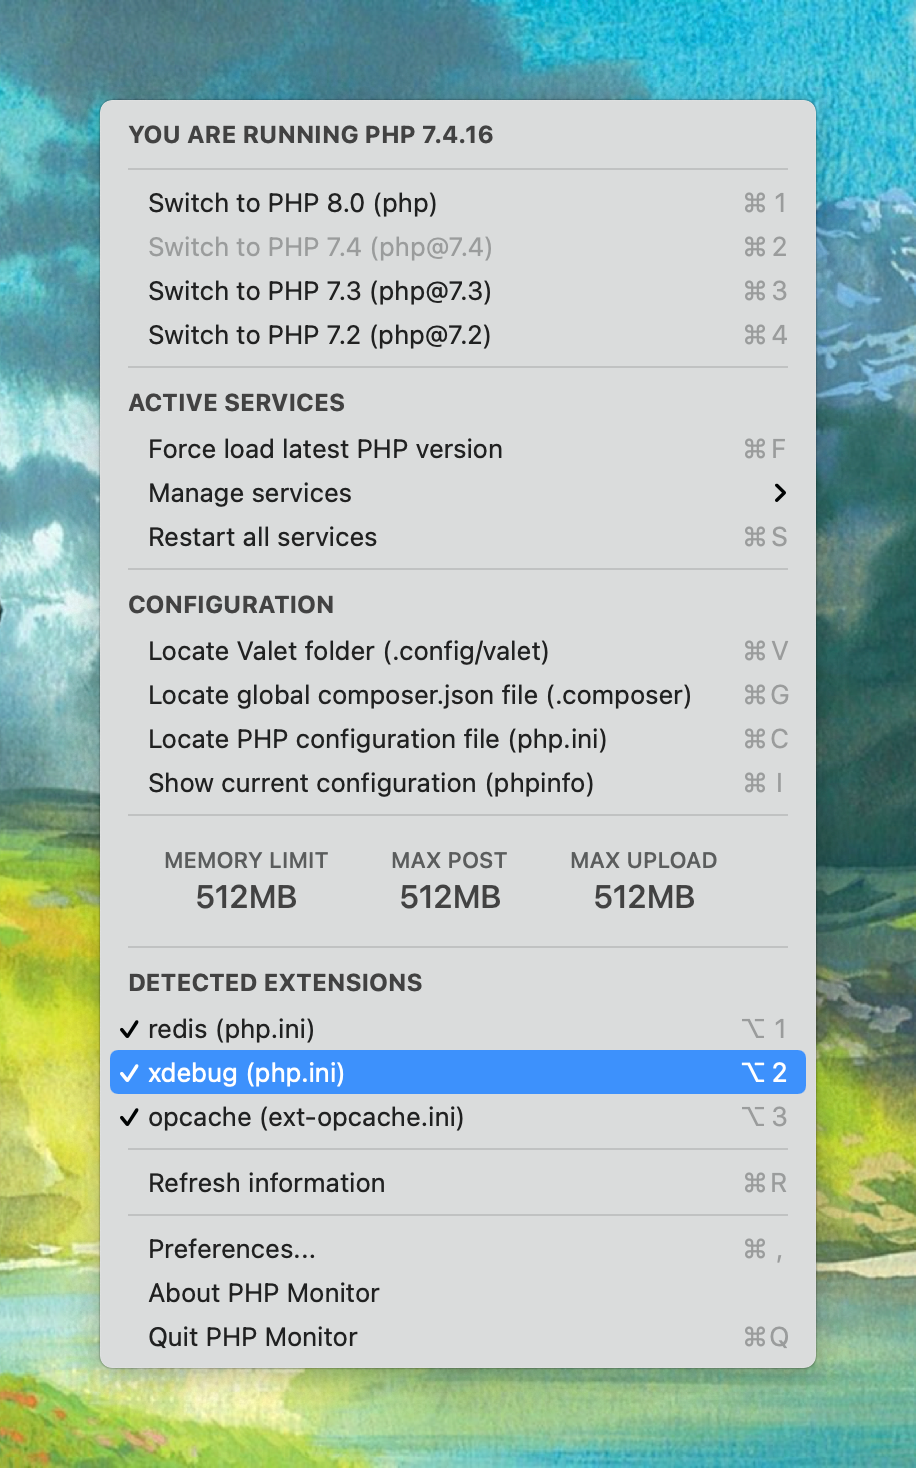
You can also verify Xdebug is installed by running php -v in your terminal and verifying the with Xdebug v3.0.4, line is included in the output or by running the phpinfo() function and searching for Xdebug information in the output.
#Configuring VS Code for Debugging
Before we begin configuring VS Code, we need to tell communicate with Xdebug that we would like it to operate in incoming web requests. Navigate to one of your PHP projects in the browser, and enable the Xdebug helper Chrome Extension for that site.
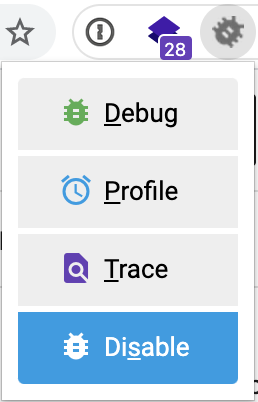
You may need to click on the Puzzle Piece icon in Chrome to show all of your installed extensions.
This debug setting appends a Cookie to every request made from this URL that is specific to Xdebug. When Xdebug sees this Cookie, it knows to prepare itself for a debugging session. This allows us to essentially bypass Xdebug when we don't need it so our web requests are still lightning fast. I believe this is a new feature (or at least exposed more directly) with version 3.
You can verify the Cookie is being sent by inspecting requests from the site in Devtools. The XDEBUG_SESSION cookie is the magic sauce! 🔥
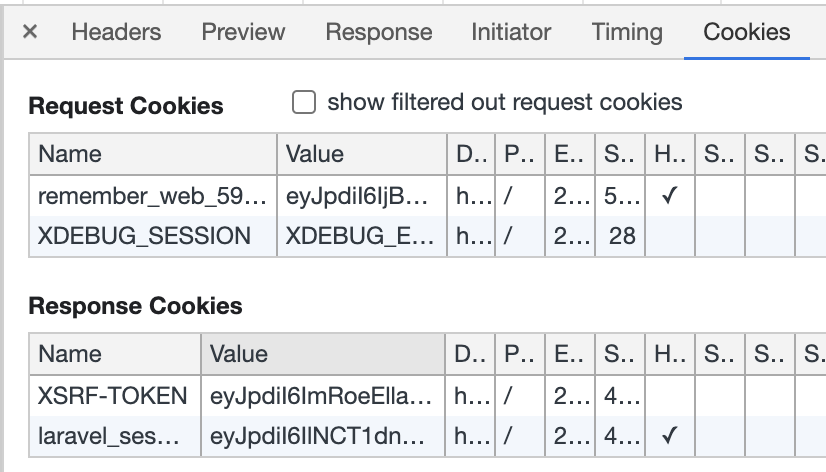
Now that our browser is sending the correct Cookies and Xdebug is installed, we can configure VS Code to listen for incoming debugging sessions. This is an important thing to understand. When debugging is enabled, Xdebug initiates the connection to your IDE, not the other way around. We must configure VS Code to respond the location Xdebug expects (or change Xdebug to connect to different ports/hosts). We'll be sticking with the defaults for this tutorial because it's easier.
Open your project in VS Code and enable the PHP Debug extension I referenced earlier. Open the debug tab in VS Code and click the gear icon near the top of your sidebar.
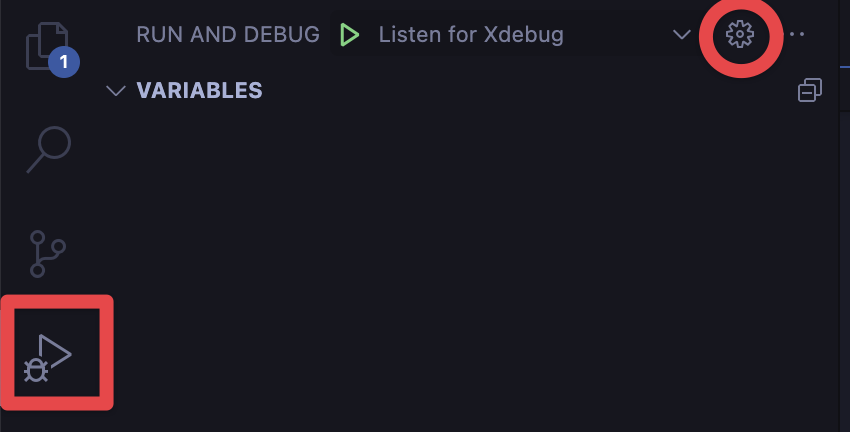
This will generate a launch.json file for you in the .vscode directory at the root of your project. You can choose to commit this to version control or not, though I generally would not recommend it since Xdebug configurations may be different across your team.
The only thing we need to change in this file is the port that VS Code is responding on. The correct port for a default install of Xdebug is 9003. You can change it for both blocks in the config file.
After this, I generally find it worthwhile to completely restart VS Code. After restarting, open the Debug tab in VS Code again and click the green arrow to "Listen for Xdebug".
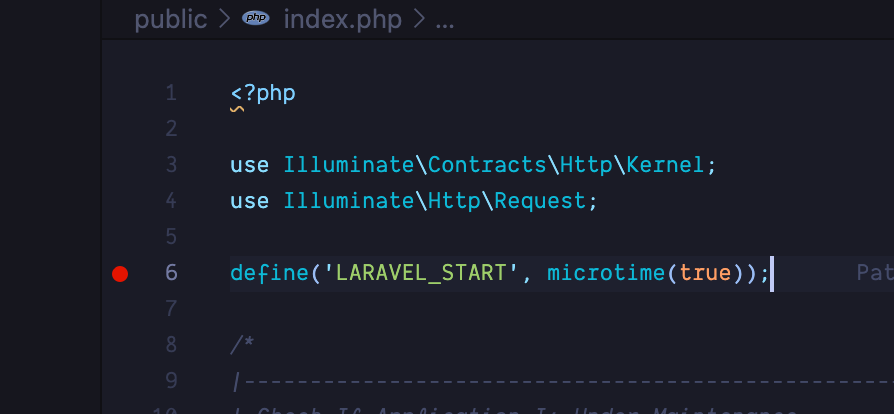
We can now add a breakpoint by clicking the red dot to the left of any line of PHP code. I recommend adding it to a variable or first line of a function.
The default public/index.php file of a Laravel Project.
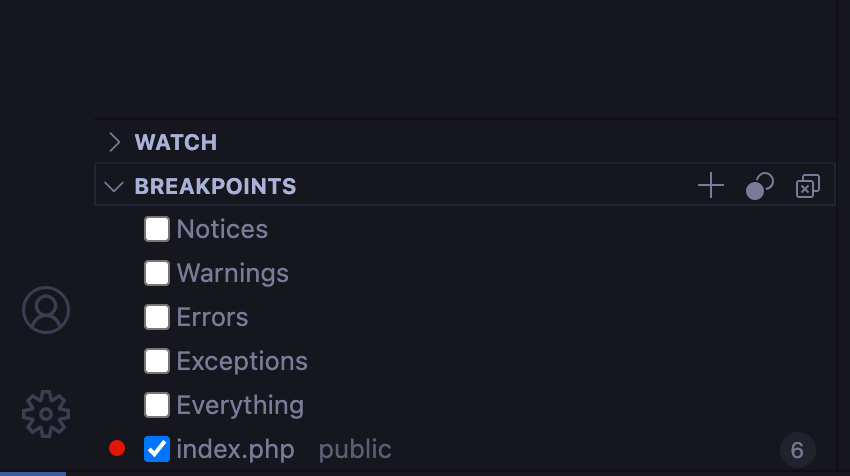
Now, open your browser, hit refresh, and hopefully VS Code will automatically focus on your breakpoint! You can disable VS Code breaking for "Everything" by unchecking the relevant box in the "Breakpoints" section of the debug sidebar.
#Conclusion
Hopefully this has been helpful to you to enable Xdebug while using Valet on a Mac. If you have any questions, feel free to reach out to me on Twitter! If you want to add something that I may have missed, reach out and I will update the post and give you credit.